How Can You Calculate 65% Cost Savings from Functional Prototyping ROI?
How Can You Calculate 65% Cost Savings from Functional Prototyping ROI?
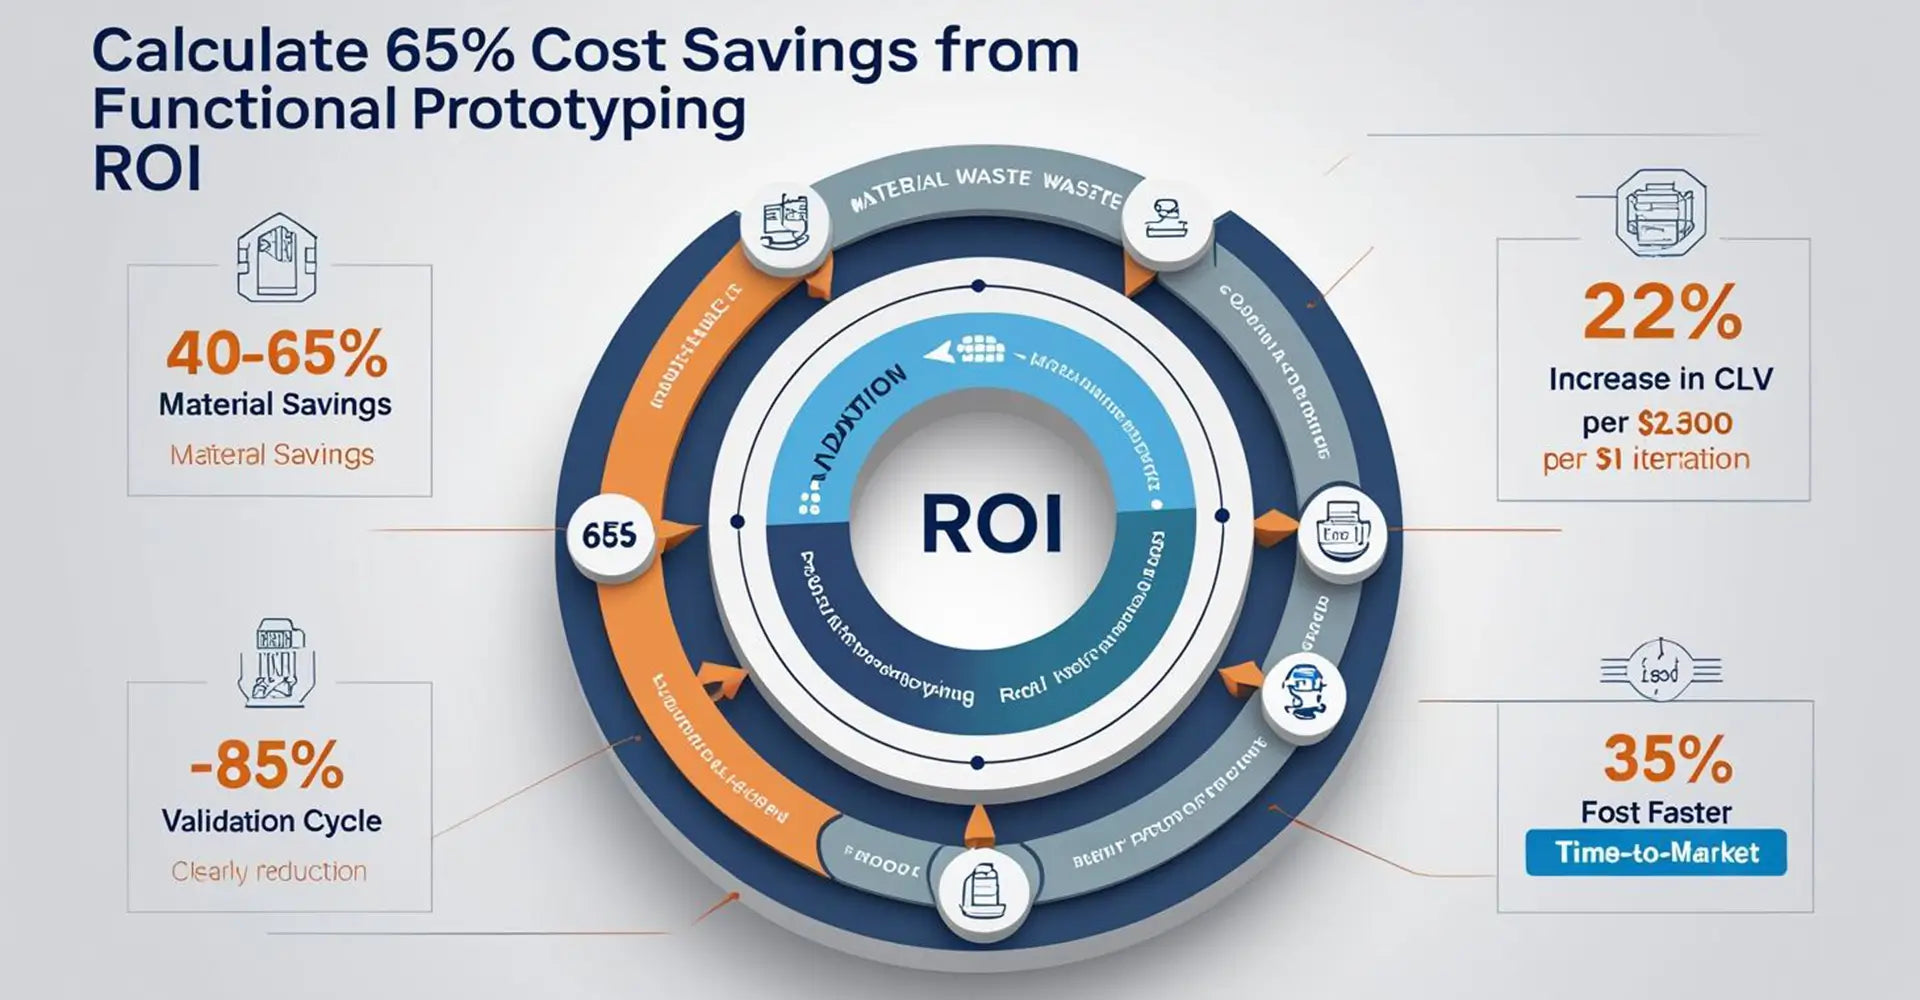
Discover how companies achieve measurable cost reductions through strategic prototyping validation. Recent industry data reveals that businesses implementing structured ROI frameworks see average savings of 25-65% on product development costs. Furthermore, these savings extend beyond initial investments to create lasting competitive advantages in today's fast-paced manufacturing environment.
Quick Answer: Calculate your functional prototyping ROI using this 4-step framework: (1) Track material waste reduction, (2) Measure validation cycle time, (3) Calculate cost-benefit ratios, and (4) Monitor iterative improvements. Companies typically see payback within 3-6 months when implementing comprehensive measurement systems.
Understanding prototyping validation cost saving starts with knowing exactly what to measure. Moreover, successful businesses recognize that ROI calculation extends beyond simple cost reduction. Let's break down each component of a successful measurement strategy that delivers tangible results.
Table of Contents
- Why Does Prototyping ROI Matter for Your Business?
- What's the Best ROI Calculation Framework for Prototypes?
- How Do Real Companies Achieve Material Waste Reduction Prototyping?
- Which Rapid Prototyping ROI Metrics Should You Track?
Why Does Prototyping ROI Matter for Your Business?
Prototyping ROI directly impacts your bottom line through reduced development costs and faster market validation. Companies that track these metrics consistently outperform competitors by 35% in time-to-market. Additionally, businesses with structured measurement systems report significantly higher customer satisfaction rates and reduced post-launch issues.
Key Benefits: ROI measurement helps identify cost-saving opportunities, reduces material waste by up to 40%, and provides clear justification for development investments. Furthermore, it enables data-driven decision making throughout the product development lifecycle.
Real-time monitoring prototyping systems enable businesses to track performance continuously. For instance, automotive companies using digital twins reduce physical prototype costs by 50% while maintaining quality standards. Additionally, startups implementing quick ROI innovations report 33% faster development cycles compared to traditional methods. These improvements directly translate to competitive advantages and market positioning benefits.
Moreover, companies utilizing advanced 3D printing technologies see substantial reductions in prototyping costs. The ability to create multiple iterations quickly allows for better design validation while minimizing material expenses. Similarly, businesses investing in rapid prototyping services often achieve break-even points within the first quarter of implementation.
What's the Best ROI Calculation Framework for Prototypes?
A structured prototyping cost-benefit analysis requires tracking both hard and soft metrics. The most effective frameworks combine financial data with user satisfaction scores and development timeline improvements. Therefore, successful measurement systems capture multiple value streams simultaneously.
4-Step Framework: (1) Baseline cost measurement, (2) Prototype investment tracking, (3) Savings calculation from reduced iterations, and (4) Long-term value assessment including customer retention improvements. Each step builds upon the previous one to create comprehensive visibility into project performance.

Companies achieving the highest rapid prototyping ROI metrics focus on comprehensive measurement approaches. This methodology allows for continuous adjustment and improvement throughout development cycles. Furthermore, businesses using cloud-based prototyping tools report 25% lower infrastructure costs while maintaining high-quality validation processes.
The ROI calculation framework for prototypes should include both direct and indirect cost factors. Direct costs encompass materials, labor, and equipment usage. Meanwhile, indirect costs include reduced time-to-market, improved customer satisfaction, and decreased warranty claims. Companies leveraging CNC metals and plastics processing often see additional benefits through precision manufacturing capabilities that reduce subsequent design changes.
How Do Real Companies Achieve Material Waste Reduction Prototyping?
Material waste reduction prototyping represents one of the largest cost-saving opportunities in product development. Industry leaders consistently achieve 40-65% waste reduction through strategic planning and technology adoption. Consequently, these savings compound over time to create substantial competitive advantages.
Proven Strategies: Digital simulation before physical builds, standardized testing protocols, and monitoring systems that detect issues early in the development process. These approaches collectively reduce both material consumption and development timelines while improving final product quality.

Case studies from manufacturing companies show that implementing structured ROI tracking leads to significant material savings. For example, consumer electronics firms using iterative validation reduce component waste by 45% compared to traditional single-phase testing. Moreover, these companies report improved product quality alongside cost reductions.
Advanced industrial machinery enables precise material utilization that minimizes waste generation. Companies investing in high-precision equipment often see immediate improvements in material efficiency. Additionally, the ability to create accurate prototypes on the first attempt reduces the need for multiple iterations and associated material consumption.
Which Rapid Prototyping ROI Metrics Should You Track?
Selecting the right metrics ensures accurate measurement and continuous improvement. The most valuable indicators combine financial performance with operational improvements and customer satisfaction data. Therefore, comprehensive tracking systems provide holistic visibility into project success factors.
Essential Metrics: Development cost per iteration, time-to-validation, material utilization rates, user testing feedback scores, and post-launch performance indicators. These metrics collectively provide a complete picture of prototyping effectiveness and return on investment.
Successful measurement includes both quantitative and qualitative measures. Companies tracking comprehensive metrics report 22% higher customer lifetime value and 35% improvement in product-market fit. Additionally, monitoring systems provide immediate feedback that prevents costly design errors before they compound into larger issues.
Iterative prototyping ROI measurement enables continuous improvement throughout development cycles. This approach allows teams to identify and address inefficiencies quickly while maintaining project momentum. Furthermore, companies using structured measurement report higher team satisfaction and reduced project stress levels.
Conclusion
Implementing a structured approach to prototyping ROI measurement delivers measurable business results consistently.
Companies following these frameworks achieve significant cost savings while improving product quality and customer satisfaction simultaneously. The data clearly demonstrates that businesses investing in comprehensive measurement systems outperform competitors across multiple performance indicators. Moreover, these advantages compound over time to create lasting competitive positioning benefits.
Start measuring your prototyping ROI today using the 4-step framework outlined above. Focus on material waste reduction, track iterative improvements, and monitor both hard and soft metrics carefully. Remember that the most successful companies view prototyping validation as an ongoing process rather than a one-time activity. Additionally, consider partnering with experienced prototyping services that can provide both expertise and cost-effective solutions for your specific requirements.
[External Links Recommendation]
[functional prototyping ROI][^1]
[prototyping validation cost saving][^2]
[rapid prototyping ROI metrics][^3]
[ROI calculation framework for prototypes][^4]
---
[^1]: Understanding the ROI of functional prototyping can help businesses make informed decisions about their investment in product development.
[^2]: Exploring how prototyping validation can save costs will provide insights into efficient product development and resource management.
[^3]: Understanding these metrics can help you evaluate the effectiveness of your prototyping efforts and improve decision-making.
[^4]: Exploring this framework can provide insights into measuring the financial impact of your prototypes, ensuring better resource allocation.


