1×2 vs. 1×8 Die Casting Molds: Is Your Cavity Count Quietly Killing Your Profit?
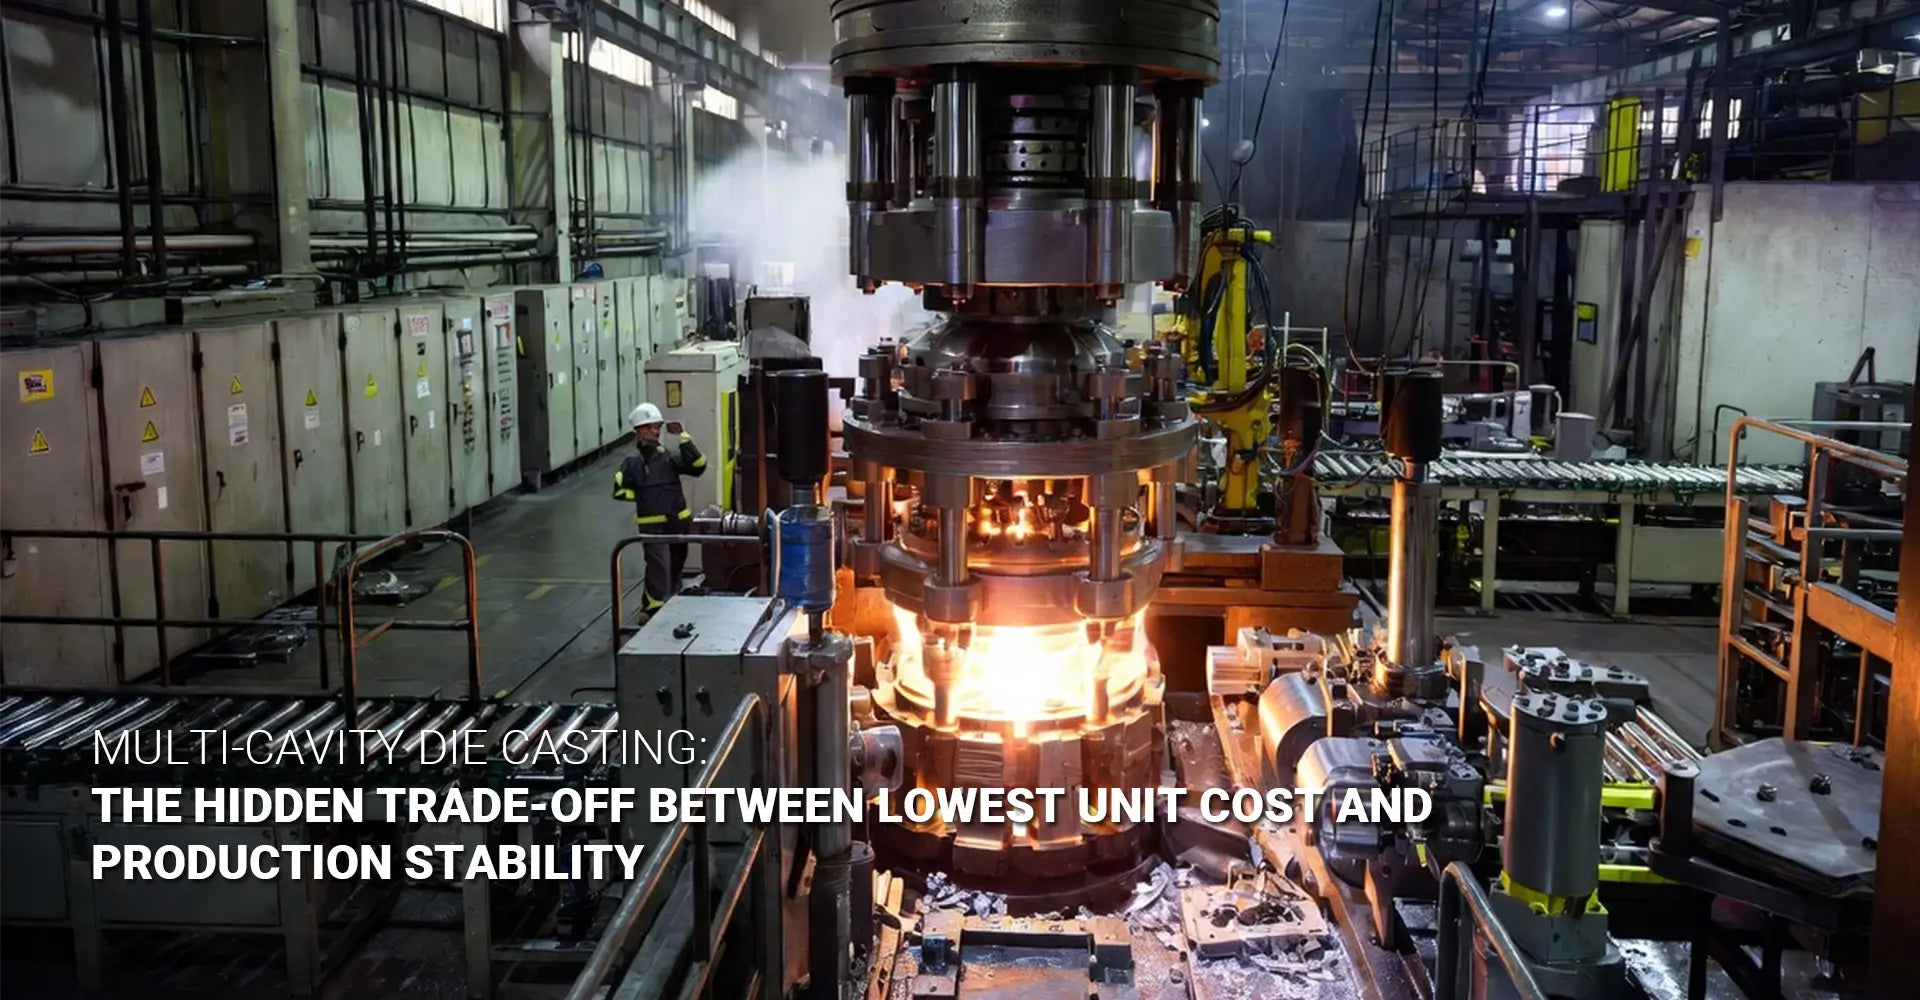
1×2 vs. 1×8 Die Casting Molds: Is Your Cavity Count Quietly Killing Your Profit?

When a supplier quotes you a great per-piece price, it feels like a win. However, that price often hides a dangerous assumption — 100% yield. In reality, your cavity count may be the single biggest driver of scrap, rework, and lost profit. So before you approve that 8-cavity tool, it is worth asking: are you actually saving money, or just moving the cost around?
⚡ Key Takeaways — Find Your Answer Fast
| Cavity Count | Typical Scrap Rate | Best Fit Volume | Stability Level |
|---|---|---|---|
| 1×2 | 2–5% | Under 5,000 parts | ⭐⭐⭐⭐⭐ Very High |
| 1×4 | 5–10% | 5,000–25,000 parts | ⭐⭐⭐⭐ High |
| 1×6 | 8–15% | 15,000–30,000 parts | ⭐⭐⭐ Medium |
| 1×8 | 10–20% | 25,000+ parts | ⭐⭐ Lower |
Bottom line: More cavities = lower quoted unit price. But more cavities also = higher scrap rates, bigger machines, and harder-to-fix problems. The "cheapest" quote is often the most expensive outcome.
These numbers are not theoretical. They reflect real production outcomes across thousands of die casting jobs. Furthermore, they reveal a pattern that experienced engineers already know — cavity count and scrap rate move together. So let us walk through exactly why that happens, and how to make the right call for your project.
Table of Contents
- The Lure of High Cavitation — Why 8 Cavities Look Great on Paper?
- The Physics Problem — Why More Die Casting Cavities Mean Less Uniform Fill?
- How Scrap Rates Actually Scale With Cavity Count in Die Casting?
- When Low Unit Cost Meets High Scrap — Where Does the Profit Go?
- Conclusion
The Lure of High Cavitation — Why 8 Cavities Look Great on Paper?
It is completely understandable to want more cavities. After all, the logic seems simple. More cavities means more parts per shot, and more parts per shot means lower cost per piece. Therefore, an 8-cavity mold must be the smartest choice — right?
Quick Answer: On paper, yes. In production, it depends entirely on your volume, part geometry, and how well the tool handles fill balance. For many projects, high cavitation tooling risks outweigh the unit cost savings.
Not so fast. The appeal of high cavitation is real, but it comes with a set of trade-offs that rarely appear in a supplier quote. Let us break down why the numbers are so seductive — and where the cracks start to show.
The Math That Seduces — 8× Output for Only 3× Tooling Cost
Here is the calculation that makes every purchasing manager lean forward:
- 1×2 mold: Tool cost $12,000 → 2 parts per shot
- 1×8 mold: Tool cost $30,000 → 8 parts per shot
So for 2.5× the tool cost, you get 4× the output. That means lower tooling cost per part, faster production, and a more attractive per-piece quote. On a spreadsheet, it is a clear win.
But this math only holds if every cavity produces a good part, every shot. As we will see, that is rarely what happens.
Why Low Piece Price Always Wins the RFQ — Until It Doesn't
Suppliers know that buyers compare per-piece prices. Consequently, they quote the number that wins the job — the price based on full yield from all cavities. Moreover, buyers rarely ask about scrap rates during the quoting stage.
The result? A 1×2 vs 1×8 die casting tool comparison that looks obvious in the quote becomes far less clear once production starts. By then, you are already committed to the tool.
The Physics Problem — Why More Die Casting Cavities Mean Less Uniform Fill?
This is where the story gets technical — but also where it gets important. The core issue is not poor engineering. Instead, it is basic physics. Metal flows according to the laws of pressure, temperature, and fluid dynamics. And those laws do not care about your per-piece target.
Quick Answer: In a multi cavity die casting mold, the metal reaching outer cavities is cooler, under less pressure, and more turbulent than the metal reaching inner cavities. This creates die casting fill uniformity problems that no runner design can fully eliminate.
Understanding this physics is essential. Because once you understand it, the scrap rate data in the next section will make complete sense. Let us go through the three main mechanisms.
Flow Path Distance — Outer Cavities vs. Inner Cavities
In a balanced runner system, the metal travels different distances to reach different cavities. Specifically, the outer cavities sit farther from the gate than the inner ones. Even with careful die casting cavity layout design, this distance difference causes:
- Higher flow resistance in the longer paths
- Greater turbulence as metal turns corners
- Lower velocity by the time metal reaches the outer cavities
The result is that outer cavities fill slightly later, with slightly less energy. Over thousands of shots, this creates a consistent quality gap between inner and outer cavities.
Temperature Variation — First-to-Fill vs. Last-to-Fill Cooling Rates
Metal that travels farther also loses more heat along the way. Therefore:
- Inner cavities receive hotter metal → better fill, fewer cold shuts
- Outer cavities receive cooler metal → higher risk of porosity, incomplete fill, surface defects
This temperature variation is one of the most difficult problems to solve in high-cavitation tooling. Even with heated runners and careful process control, the gap never fully closes.
Pressure Drop — The Law of Diminishing Returns in Long Runners
Every meter of runner, every corner, every gate restriction causes a pressure drop. In a 1×2 mold, this drop is small and manageable. However, in a 1×8 mold, the cumulative pressure drop to the outer cavities can be significant enough to cause:
- Short shots — the cavity does not fill completely
- Surface sink marks — insufficient packing pressure after fill
- Dimensional variation — parts that are slightly undersized due to low pressure
These are not random defects. They are systematic problems tied to the physics of the runner system — and they affect the same cavities, shot after shot.
How Scrap Rates Actually Scale With Cavity Count in Die Casting?
Now let us look at the numbers. The following scrap rate ranges come from real production experience across a wide range of part geometries and alloys. They represent typical outcomes, not worst-case scenarios.
Quick Answer: Scrap rates roughly double with each step up in cavity count, from about 2–5% in a 1×2 mold to 10–20% in a 1×8 mold. This is the foundation of any honest die casting scrap rate calculation.
These are not numbers to gloss over. At scale, even a 5% difference in scrap rate translates directly into lost revenue and wasted machine time. Here is what each configuration typically delivers.
1×2 Mold — Typical Scrap 2–5%, Easy to Diagnose
A 1×2 mold is the most controllable configuration. With only two cavities, the flow paths are short and nearly identical. Furthermore:
- Fill balance is easy to achieve and maintain
- Defects are easy to trace — if one cavity underperforms, it is immediately obvious
- Process adjustments are fast — changing shot speed or temperature affects both cavities predictably
- Mold cavity optimization is straightforward with minimal variables
For low-volume or precision-critical parts, a 1×2 tool is almost always the right starting point.
1×4 Mold — Typical Scrap 5–10%, Some Cavities Underperform
A 1×4 mold is the most common "balanced" choice for mid-volume production. It offers a meaningful productivity gain over 1×2 while keeping scrap rates manageable.
- Some cavity variation is expected but controllable
- Good process engineers can typically bring scrap below 7% with careful setup
- Setup time increases compared to 1×2, but not dramatically
- Tooling cost per part remains competitive across 5,000–25,000 pieces
This is the configuration most experienced die casters recommend for volumes between 5,000 and 25,000 pieces per year.
1×8 Mold — Typical Scrap 10–20%, Outer Cavities May Be Unusable
This is where things get difficult. A 1×8 mold introduces enough complexity that production stability die casting becomes a constant challenge.
- Outer cavities consistently underperform inner ones
- Setup and balancing can take hours at the start of each run
- One damaged cavity takes the entire tool offline
- Quality control burden multiplies — 8 cavities means 8 streams of parts to inspect and sort
- Scrap rates of 15–20% are not unusual for complex geometries
At this level, the "faster production" argument starts to fall apart. Because producing 8 parts per shot at 15% scrap is not actually faster than producing 2 parts per shot at 3% scrap — it just feels that way.
When Low Unit Cost Meets High Scrap — Where Does the Profit Go?
This is the section that matters most to your bottom line. Let us take everything above and put it into real numbers. This is where die casting cost modeling moves from theory into a decision tool you can actually use.
Quick Answer: On a 5,000-piece order, an 8-cavity mold with 15% scrap can produce 600–750 fewer sellable parts than a 2-cavity mold. That lost output often exceeds the tooling savings entirely — making the "cheaper" tool the more expensive choice.
The math here is not complicated. But it requires using realistic scrap rates — not the optimistic numbers that appear in a supplier's quote.
The 5,000-Piece Trap — 1×8 Tool Savings vs. 300–600 Scrapped Parts
Let us model a real scenario. You need 5,000 good parts. Two suppliers quote you:
| Option A: 1×2 Mold | Option B: 1×8 Mold | |
|---|---|---|
| Tooling Cost | $12,000 | $28,000 |
| Expected Scrap Rate | 3% | 15% |
| Parts Needed (with scrap) | ~5,155 shots worth | ~5,882 shots worth |
| Scrapped Parts | ~155 parts | ~882 parts |
| Cost of Scrapped Parts (@ $4/part material) | ~$620 | ~$3,528 |
| Total Effective Cost | $12,620 | $31,528 |
| Tooling Cost Per Good Part | $2.52 | $6.31 |
The 1×8 mold does not save money here. It costs 2.5× more per good part once scrap is included.
This is what tooling cost per part actually looks like when you use honest numbers. The formula is simple:
Cost per good part = (Tooling Cost + Scrap Cost) ÷ Good Parts Delivered
Run this calculation before you approve any tooling decision.
Real Example — How 18% Scrap on an 8-Cavity Job Erased All Tooling Savings
Here is a case from real production. A manufacturer needed 8,000 automotive components annually. Their supplier proposed a 1×8 mold, citing a tooling cost saving of $14,000 versus a 1×4 alternative.
Production started. Within the first three months:
- Outer two cavities consistently produced parts with porosity and dimensional variation
- Scrap rate climbed to 18% — well above the supplier's estimated 8%
- 1,440 parts per year were scrapped instead of the expected 640
- Rework and re-inspection costs added another $6,200 annually
- The $14,000 tooling saving was consumed in less than 14 months
After switching to a 1×4 mold with careful runner design and proper die casting tooling design practices, scrap dropped to 6% and stayed there.
How to Calculate True Cost Per Good Part (Formula Included)
Use this formula for any cavity count comparison. It works for industrial machinery parts, consumer products, and surface-finish-critical components alike:
True Cost Per Good Part =
  (Tooling Cost ÷ Total Lifetime Parts)
  + (Machine Cost Per Shot ÷ Cavities)
  ÷ (1 − Scrap Rate)
Example inputs for a 10,000-piece run:
| Variable | 1×2 Mold | 1×8 Mold |
|---|---|---|
| Tooling Cost | $12,000 | $28,000 |
| Machine Cost/Shot | $0.80 | $1.60 (larger machine) |
| Scrap Rate | 3% | 15% |
| True Cost/Good Part | $1.65 | $3.12 |
Always use realistic scrap rates (not theoretical minimums) when running this model. When in doubt, use the midpoint of the typical range for your cavity count.
Conclusion
More cavities is not always better. In fact, for most projects under 25,000 pieces per year, fewer cavities consistently deliver lower true cost, higher yield, and better production stability.
Here is what to remember:
- ✅ 1×2 molds are the most stable and the easiest to control — best for low volumes and tight tolerances
- ✅ 1×4 molds offer a genuine balance between productivity and scrap control — the sweet spot for most mid-volume work
- ⚠️ 1×8 molds make sense at high volumes (25,000+ parts), but only with expert runner design, larger machines, and realistic scrap budgets
- 📊 Always calculate cost per good part — not cost per shot and not tooling cost alone
- 🔍 Ask your supplier for scrap rate data from similar parts at the same cavity count — not theoretical estimates
The best cavity count is not the one that looks cheapest in the quote. It is the one that delivers the lowest total cost per sellable part over your full production run. Get that number right, and the rest of the decision becomes straightforward.
🔗 External Links & Further Reading
[Die casting tooling design][^1]
[multi cavity die casting mold][^2]
[die casting cavity layout][^3]
[1x2 vs 1x8 die casting tool][^4]
[die casting fill uniformity][^5]
[^1]. This beginner's guide outlines essential die casting tooling design principles, focusing on Design for Manufacturability (DFM ) to reduce costs by optimizing wall thickness, draft angles, and tolerance zones for better ROI.
[^2]. Protolabs provides a technical overview of multi-cavity mold design, discussing key considerations such as gating, side actions, and the "crossover" point where multi-cavity tooling becomes more cost-effective than single-cavity options for mass production.
[^3]. This comprehensive analysis by CEX Casting explores the critical role of die casting mold cavity design, detailing various layout types such as single-cavity, multi-cavity, and family dies, while emphasizing the importance of balanced filling and cooling system optimization.
[^4]. Dynacast provides expert insights into optimizing die casting tools for maximum efficiency, comparing different tooling configurations and explaining how multi-cavity layouts (like 1x2 or 1x8 ) impact cycle times, tool life, and overall return on investment for high-volume production.
[^5]. This technical case study from FLOW-3D CAST demonstrates how simulation software optimizes High Pressure Die Casting (HPDC ) systems to achieve superior fill uniformity, reducing turbulence and air entrapment while significantly improving overall casting quality and process stability


