Why Your Industrial CNC Parts Inventory Is Costing You More Than You Think — And What to Do About It?
Why Your Industrial CNC Parts Inventory Is Costing You More Than You Think — And What to Do About It?

Every plant manager knows the feeling. You walk past rows of shelving packed with cast spare parts. Some are dusty. Some are wrapped in plastic from years ago. And somewhere in the back, there are parts for machines you no longer even run.
Here's the uncomfortable truth: you're not just storing parts — you're paying for them every single day.
Between warehouse rent, insurance, taxes, obsolescence risk, and tied-up capital, your industrial CNC parts inventory could be quietly draining tens of thousands of dollars a year. And most companies never fully add it up.
⚡ Key Takeaways (Read This First)
| Factor | Physical Inventory | Digital Inventory |
|---|---|---|
| Warehouse space cost | $7–$15/sq ft/year | $0 |
| Inventory carrying cost | 20–30% of part value/year | $0 |
| Tooling cost (obsolete parts) | $5,000–$15,000 per part | $500 CAD model |
| Lead time | 8–12 weeks (casting) | 1–2 weeks (machining) |
| Obsolescence risk | High | Zero |
| 3-year total cost (example) | ~$29,000 | ~$4,100 |
Bottom line: A digital spare parts inventory backed by on-demand CNC machining can cut your carrying costs by up to 80% — while eliminating stockouts and obsolescence risk entirely.
So how exactly does the math work? And what does it take to make the switch? In the sections below, we break down the hidden costs of physical inventory, explain how the digital model works, walk through a real cost comparison, and give you a clear roadmap to get started.
Table of Contents
- What Are You Really Paying to Store Cast Spare Parts?
- What Is a Digital Spare Parts Inventory — And How Does It Work?
- Physical Inventory vs. Digital Inventory — What Do the Numbers Say?
- How Do You Start Converting to a Digital Spare Parts Inventory?
- Conclusion
What Are You Really Paying to Store Cast Spare Parts?
Most companies track what they paid for a part. But very few track what they keep paying — every year the part sits unused on a shelf. The true cost of physical spare parts storage is made up of several layers. And when you add them all together, the number is often shocking.
The Real Cost Breakdown
Here's what your spare parts inventory cost reduction opportunity actually looks like:
Warehouse Space
- Industrial warehouse space averages $7–$15 per square foot per year, depending on your region.
- A single pallet of spare parts occupying just 20 square feet costs $140–$300/year in rent alone.
- Most facilities don't charge this back to individual part lines — so the cost stays invisible.
Inventory Carrying Cost
- Inventory carrying cost calculation for industrial parts typically runs 20–30% of part value annually.
- That includes: capital cost (opportunity cost of the tied-up cash), insurance, taxes, and obsolescence write-downs.
- A $500 casting sitting unused for 3 years accumulates $300–$450 in carrying cost — more than the part itself.
The Obsolescence Trap
- OEMs typically discontinue replacement parts after 10–15 years.
- Companies often order 50–100 "just in case" extras during a casting run — paying full carrying cost on every single one.
- Those extras frequently outlive the machine they were meant to support.
The "just in case" mindset is the single biggest driver of wasted inventory spend. When a casting run is open, it feels logical to order extras. Tooling is already paid for. The per-unit price drops. So companies order 50 or 100 additional pieces "while we're at it."
But for a $500 part, 100 extras represent $50,000 in upfront inventory. Add 25% annual carrying cost, and you're spending $12,500 per year to store parts you may never use. Over a 10-year machine lifecycle, that's $125,000 in carrying cost — on top of the original purchase.
This is the core problem that asset management industrial parts strategies are designed to solve. The answer isn't better shelving. It's eliminating the inventory entirely.
What Is a Digital Spare Parts Inventory — And How Does It Work?
A digital spare parts inventory replaces physical stock with something far more compact: a secure library of 3D CAD models and manufacturing process plans. Instead of storing the part, you store the instructions to make it. When a part fails, you send the file to a machining partner. They produce exactly what you need — and ship it in days, not months.
How It Works, Step by Step
Here's the complete flow from physical part to digital readiness:
- Scan or measure an existing physical part to capture all critical dimensions.
- Create a 3D CAD model — a precise digital twin of the part, including tolerances, material specs, and interface points.
- Store the digital file securely. No warehouse. No shelving. No insurance.
- When a part fails, send the file to your CNC machining service partner.
- Receive the machined replacement in 1–2 weeks. Fit it. Run it.
"You carry zero physical inventory, pay zero storage costs, and eliminate obsolescence risk — permanently."
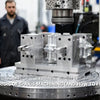
The reason on demand CNC machining makes this model possible is the flexibility of modern 5-axis machining centers. Many legacy spare parts were originally cast because their geometry was too complex for 3-axis machining. Angled ports, undercut features, compound contours — these were "cast because we had to."
Today, 5 axis on demand manufacturing can reproduce those same geometries in a single setup, often with tighter tolerances than the original casting. The result: a machined part that fits, functions, and lasts — without a single unit sitting in your warehouse.
For companies managing industrial machinery with aging equipment fleets, this capability is a genuine shift in how spare parts can be sourced and managed.
Physical Inventory vs. Digital Inventory — What Do the Numbers Say?
Let's stop talking in theory and put real numbers side by side. The following comparison uses a real-world scenario: a single legacy cast spare part that a manufacturer currently stocks physically — versus the same part managed digitally with on-demand machining.
The 3-Year Cost Comparison
Traditional Physical Inventory Model:
| Cost Item | Amount |
|---|---|
| Pattern/tooling cost (one-time) | $15,000 |
| Storage cost (Year 1–3, 20 sq ft × $12/sq ft) | $720 |
| Carrying cost (Year 1–3, $500 part × 25% × 3 years) | $375 |
| Obsolescence write-down risk | High |
| 3-Year Total | ~$16,095 per part type |
Digital Inventory + On-Demand Machining Model:
| Cost Item | Amount |
|---|---|
| CAD model creation (reverse engineering) | $500 |
| Storage cost | $0 |
| Carrying cost | $0 |
| Machining cost per replacement (when needed) | $1,200–$2,500 |
| 3-Year Total (1 replacement) | ~$2,000–$3,000 |
3-year savings: $13,000–$14,000 on a single part type. Multiply that across an inventory of 50–100 legacy part numbers, and you're looking at $650,000–$1,400,000 in recoverable cost.
The inventory carrying cost calculation formula is straightforward — but most companies never apply it at the part-number level:
Annual Cost per Part = (Warehouse $/sq ft × footprint) + (Part Value × Carrying Cost %)
Example:
- Part value: $500
- Warehouse cost: $12/sq ft, 4 sq ft footprint = $48/year
- Carrying cost: $500 × 25% = $125/year
- Total annual cost: $173 just to own it
If that part fails once every 5 years, you're paying $865 in carrying cost before you ever use it. For a machined replacement at $1,200–$2,500, you're already close to break-even — and you haven't factored in the tooling cost yet.
This math is especially compelling for discontinued part manufacturing scenarios — parts where the OEM no longer offers tooling, and new casting runs would require $5,000–$15,000 in pattern investment just to get started.
The metals and plastics available through modern CNC machining include everything from carbon steel and stainless to aluminum alloys and engineering plastics — giving you full material flexibility without committing to a casting alloy years in advance.
How Do You Start Converting to a Digital Spare Parts Inventory?
The good news: you don't need to convert your entire warehouse overnight. The smartest approach is phased. Start with the parts that cost the most to store — or that carry the highest downtime risk if they fail. Build confidence in the digital model. Then expand from there.
The 4-Step Roadmap
Here's a proven implementation path for companies moving from physical stock to virtual inventory management:
Step 1: Audit Your Current Spare Parts Warehouse
- Walk the floor. Identify every part that hasn't moved in 2+ years.
- Flag high-value parts (over $500 each) and machine-critical spares (failure = line down).
- Calculate annual carrying cost per part using the formula above.
Step 2: Identify the Best Candidates for Digital Conversion
- Best fit: obsolete parts machining candidates, low-volume spares, high-value parts, parts for legacy or discontinued equipment.
- Less suitable: high-volume consumables (e.g., filters, belts), commodity parts with very low unit cost.
- Start with 20–30 part numbers. Don't try to digitize everything at once.
Step 3: Reverse Engineer and Create CAD Models
- Scan or measure existing physical parts.
- Capture all critical interfaces: mounting holes, shaft fits, sealing surfaces, tolerances.
- Validate the digital model against the physical part before decommissioning stock.
Step 4: Phase Out Physical Inventory
- Have one part machined on-demand and verify fit before reducing stock.
- Gradually reduce physical quantities as digital capability proves reliable.
- Apply just in time spare parts logic: order one when you need one. No more "just in case" bulk runs.
Questions to ask your machining partner before committing:
- What is your standard lead time from file to shipped part?
- Which materials do you stock for on-demand production?
- How do you handle file security and IP protection for our CAD models?
- What tolerance capabilities does your 5-axis equipment support?
- Do you offer any volume or subscription pricing for ongoing digital spare parts programs?
The right machining partner makes or breaks this model. For automotive component manufacturers and industrial equipment OEMs alike, the ability to machine complex geometries on demand — without minimum order quantities — is what makes digital spare parts inventory practical at scale.
One industrial equipment manufacturer who implemented this approach documented the following results:
- Annual spare parts carrying cost before: $187,000
- Investment in digital inventory program: $42,000 (first year)
- Annual carrying cost after: $38,000
- First-year savings: $107,000
- Payback period: under 6 months
Beyond the direct savings, they eliminated 12 hours of annual downtime waiting for obsolete parts — a value that far exceeds the cost reduction alone.
Conclusion
Physical spare parts inventory feels safe. But safety has a price — and most companies are paying it without ever calculating what it actually costs.
Here's what we know:
- Warehouse space costs $7–$15 per square foot per year.
- Carrying costs add 20–30% of part value annually.
- Obsolete parts can sit for 10–15 years, accumulating cost until they're written off.
- On-demand 5-axis CNC machining can reproduce even complex cast geometries in 1–2 weeks.
- The 3-year cost gap between physical and digital inventory is often 7:1 or greater.
The shift from physical warehousing to digital spare parts management isn't about cutting corners. It's about carrying exactly what you need — and machining the rest, exactly when you need it.
Your next step: Start with a parts audit. Pick the 20 most expensive parts to store. Run the carrying cost calculation. The numbers will tell you what to do next.
📚 Recommended External Resources
[Digital spare parts inventory][^1]
[Obsolete parts machining][^3]
[Spare parts inventory cost reduction][^4]
[5 axis on demand manufacturing][^5]
[^1]: ZOLLER's integrated tool management software that creates a digital identity for every tool, enabling complete traceability, lifecycle monitoring, and seamless data transfer between tool presetters and CNC machines—reducing downtime from missing tools and preventing unnecessary tool purchases through centralized inventory visibility [citation:5]
[^2]: Norck's digital manufacturing platform offering on-demand CNC milling, turning, and drilling with fast quoting, rapid tooling, and flexible production scheduling—engineering-led with DFM validation and ISO-certified quality control across aerospace, medical, and defense sectors
[^3]: Tri-Tec Manufacturing case study on remanufacturing Navy actuator housings using custom Heule back spot-facing tools when original tooling was discontinued—demonstrating how custom tooling solutions enable obsolete part machining for 40-50 year service life components
[^4]: Comprehensive guide from BigRep on digital inventory transformation using 3D printing to eliminate physical spare parts stockpiling. Includes detailed cost comparison showing 25% annual carrying cost elimination, ROI calculator with ~6 month payback period, real-world aerospace case studies (Leonardo helicopter rotor cradles, SAS jet engine covers), and a 5-step implementation roadmap with ABC/XYZ classification methodology for identifying digital inventory candidates.
[^5]: Neuson Hydrotec case study from MTI Magazine documenting 48% production time reduction by transitioning from 7 setups on vertical turning and 3-axis milling to single-setup 5-axis machining on a Starrag HEC 800 5X MT. Achieved positioning accuracy <0.03mm at 45° angles, eliminated complex fixture requirements, and reduced turned parts processing time by 20% through multi-cutting tools and faster rapid traverse


